
A soil moisture sensor gives you a number — and on its own, that number is useless. Its value only emerges once you know what “wet enough”, “ideal” and “too dry” mean in your soil, for your trees, at that point in the season. This guide for fruit growers (apple, pear and cherry) walks step by step through how to translate your sensor’s %VWC into the right irrigation decision.
We start from one assumption, because everything rests on it: the sensor measures the actual volumetric water content (%VWC) objectively and correctly, across different soil types. In other words, the device reliably measures how much water is physically present in the soil. The question, then, is not “is the reading correct?” but “what do I do with that reading?”
What does a soil moisture sensor measure? %VWC explained
%VWC stands for volumetric water content. It is the share of the soil volume made up of water. 30% VWC means that 30% of a given soil volume is water; the rest is solid particles and air.
The key insight for what follows: the same %VWC does not mean the same thing for the plant in every soil. A sandy soil at 18% VWC may already feel bone-dry to the tree, while a clay soil at 18% still readily releases water. The number is objective; its meaning depends on your soil texture. That is exactly why a general rule like “keep it around 25%” is not enough. Everything revolves around three reference points that you establish for each situation.
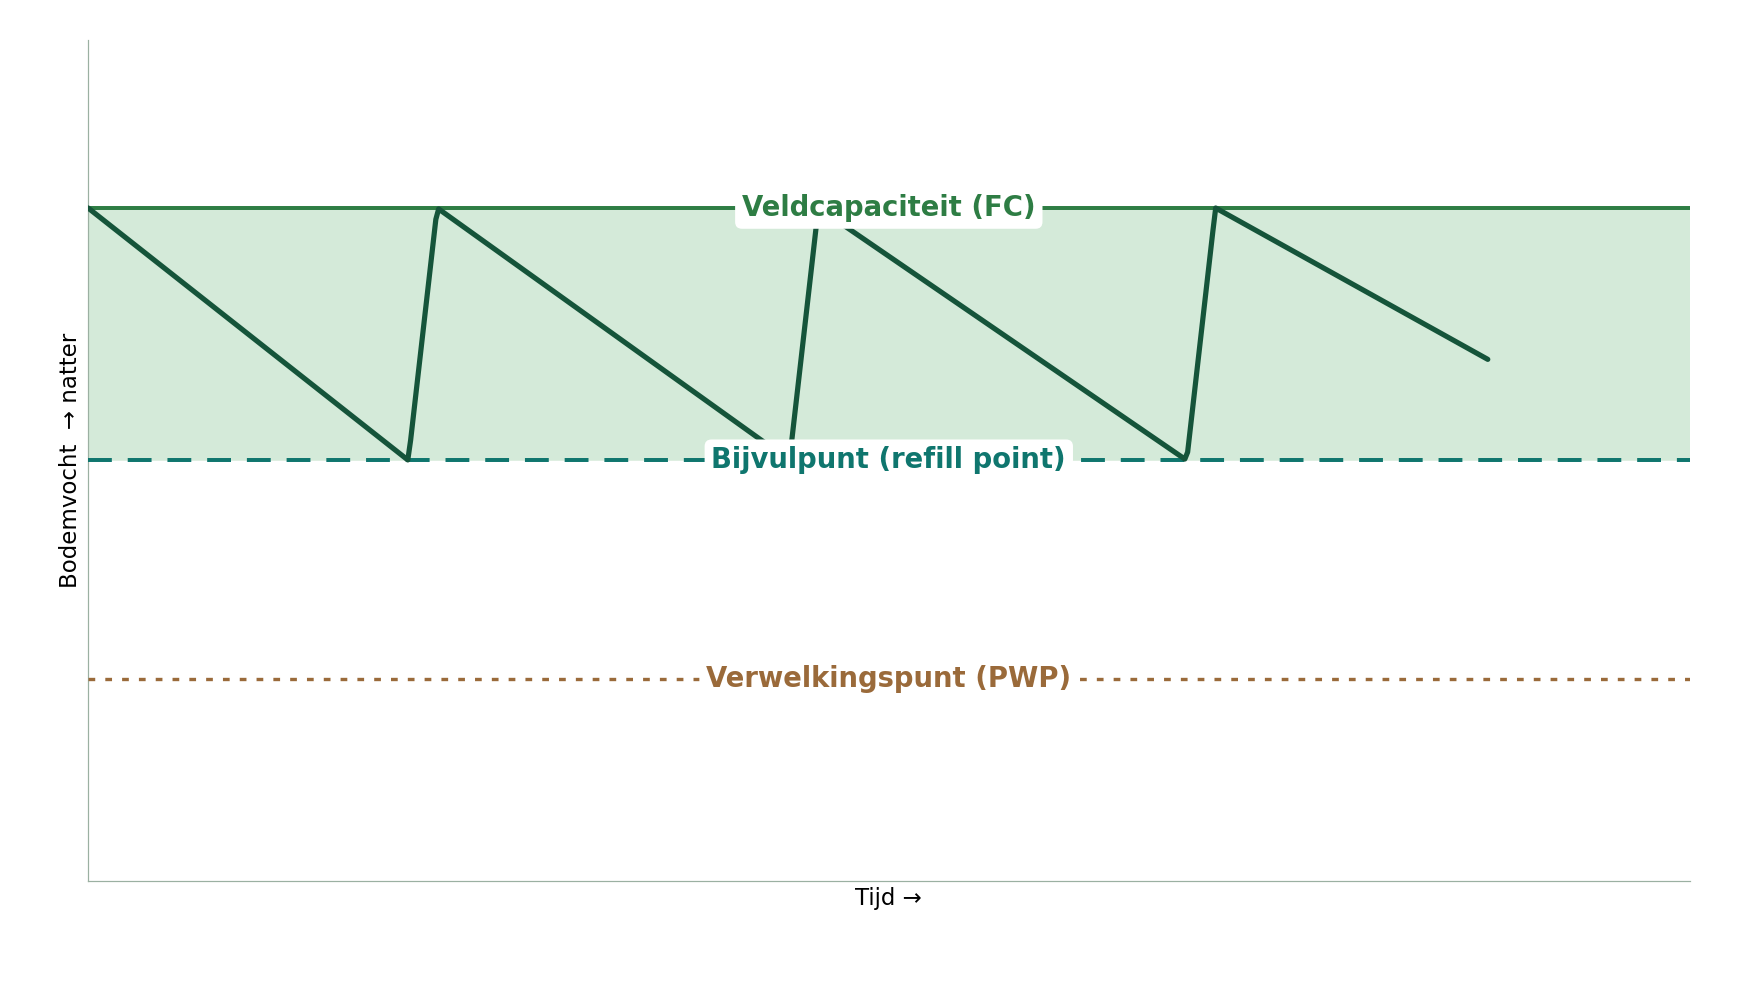
The three anchor points that set your thresholds
1. Field capacity (FC)
This is the water content that remains after gravity has drained away the excess water. It is the upper limit of useful water: anything above it drains away or displaces the oxygen in the soil, with a risk of root suffocation — especially in lower-lying, wetter spots in the plot.
2. Permanent wilting point (PWP)
This is the water content below which the tree can no longer draw water from the soil. The lower limit.
3. The refill point (trigger point)
Between FC and PWP sits the available water (available water capacity, AWC). But you do not let the soil dry out to the wilting point — by then the tree has long been under stress. You intervene earlier. For fruit trees, 50% of the available water is generally taken as the allowable depletion (the management allowable depletion, MAD). Broader guidelines for most crops cite a depletion of 30 to 50% before stress sets in; for orchards you sit at the upper end of that range.
You calculate your refill point like this:
Refill point (%VWC) = Field capacity − ( MAD × ( Field capacity − Wilting point ) )
Worked example. Suppose field capacity is 32% VWC and the wilting point is 14% VWC. The available water is then 32 − 14 = 18 percentage points. At a MAD of 50%, you let half of that (9 percentage points) dry down before irrigating again. Your refill point therefore sits at 32 − 9 = 23% VWC. Your target zone becomes: swing between 23% (irrigate) and 32% (full, do not go higher). The beauty of this approach: you do not have to guess the thresholds. Two of the three anchor points can be measured in your own plot.
How to determine the thresholds in your orchard
1. Measuring field capacity yourself
This is the most practical and reliable calibration you can do, and all you need is your sensor.
- Early in the season (or after installation), apply a heavy dose of water, or wait for a good rain shower, so the soil around the sensor becomes saturated.
- Let gravity do its work and read the sensor 12 to 24 hours later, preferably in the morning.
- The value you then see is your field capacity for that depth. The excess water has drained away and little is yet lost to transpiration and evaporation.
Do this separately for each sensor depth, because even at different depths within the same orchard the values can differ.
2. Measuring the wilting point
This is the common methodology used in practice today. The wilting point is hard to measure yourself in the field without drying down to stress. Both practical routes therefore start from a soil sample you send to a lab — they differ only in what the lab determines:
- Directly on the sample (water retention): using a pressure-plate/pF method, the lab measures how much water the soil still holds at the suction of the wilting point (−1.5 MPa, or pF 4.2). That gives you the wilting point for that specific soil straight away.
- Via the soil type (texture): the same analysis (or a simpler texture determination) gives the sand, silt and clay fractions. With that texture class you then look up a published table or pedotransfer value for the wilting point from a soil database.
The first route is more accurate and plot-specific; the second is faster and cheaper. For most practical situations, a good field-capacity measurement plus such a table value for the wilting point is enough to set a workable refill point.
3. Establishing the wilting point with the help of a dendrometer
If you also have a dendrometer at the same location, you can approach the wilting point from the tree rather than from the soil. Note: a dendrometer measures the tree, not the ground, so it does not give you the soil-physics constant (≈ −1.5 MPa). What it does give is the %VWC at which this tree in this soil actually starts to show stress — in practice your relevant lower limit.
The method: log the soil moisture sensor (%VWC) and the dendrometer together across a few dry-down cycles. The dendrometer’s early stress signals — a rising maximum daily shrinkage (MDS), an accumulating tree water deficit (TWD) and a flattening daily growth — reveal the moment the tree begins to feel the shortage. Read the %VWC at that point: that is your tree-validated onset of stress.
The biggest gain is in your refill point. Set it a margin above the stress point you just found (to absorb the lag time), and you have turned the theoretical "50% MAD" refill point into an empirical value for your own plot. You can then adjust it per phenological phase: tighter during critical periods such as cell division and fruit growth.
Points of attention: dendrometer signals are co-determined by the weather (evaporative demand/VPD), the crop load and the day-night cycle — so work with reference trees and look at the TWD trend over several days rather than at single readings. And because the dendrometer integrates the whole root zone while the soil probe is a point measurement, placement and representativeness remain important. In short: the soil sensor tells you how much water is in the ground, the dendrometer tells you whether the tree minds — together you fine-tune your thresholds.
Why thresholds differ per soil type
This is the crux of the matter. The sensor does not need to be recalibrated per soil type (we assumed it measures %VWC correctly everywhere). But the thresholds do, because the three anchor points shift with texture. Broadly: coarser soils (sand) hold less water than finer soils such as loam and clay.
- Sandy soil: low field capacity, narrow window between wet and dry, fast dry-down. Your thresholds sit low and close together. You will need to irrigate more often in smaller doses.
- Loam/silt: wider window, slower dry-down, more comfortable to manage.
- Clay: high water-holding capacity, but watch for saturation and oxygen shortage at the roots; here the upper limit is at least as important as the lower one.
If you have plots with different soil types, a single set of thresholds for the whole orchard is wrong. Two common strategies: place the sensor in the most representative soil of the block if you want to limit water use and steer on the average, or place it in the sandiest, fastest-drying zone if you do not want any tree to experience stress — then the rest gets water in time anyway. For sloping plots this is extra relevant: lower-lying trees stay wetter (risk of saturation), higher ones dry out faster. Sensors are then placed strategically in both the highest (drier) and the lowest (wetter) parts of the irrigation block.
At what depth do you place a soil moisture sensor?
For fruit trees, one measuring point is not enough. You want to see the behaviour at different depths, because each layer tells you something different.
- Root distribution: although tree roots can reach metres deep, in a mature tree almost all root mass sits in the top 60 to 90 cm. That is where water uptake happens.
- Recommended approach: monitor at several depths, from just below the cultivation or grass layer (about 10–15 cm) to roughly 70% of the effective rooting depth. A common practical set-up places sensors at about 30, 60 and 90 cm. A rule of thumb from irrigation science is to place sensors at one third and two thirds of the root-zone depth.
- What each depth tells you: the top sensor responds quickly to irrigation and evaporation (the working zone); the middle one sits in the zone with the most active roots (your control zone); the deepest tells you whether water is draining below the roots. If it drops suddenly, you are irrigating too heavily and flushing water (and fertiliser) below the root zone.
- Placement relative to tree and dripper: put the sensor under the drip line, in the zone where roots take up water most actively, at a representative distance from both tree and dripper. Avoid disturbed spots (old planting holes, backfilled zones, mounds or hollows).
Lag time: why your sensor seems to react “too late”
This is the part that confuses many new users, and where wrong conclusions arise. When you irrigate or it rains, you do not see it on the sensor straight away. Between the moment water falls at the surface and the moment it reaches the sensor at depth and shows up as a higher %VWC, there is a delay. We call this the lag time.
How big is the delay?
It depends on depth, soil texture and how dry the soil was. A concrete example from a peach orchard makes it tangible: during a four-hour irrigation, because the top layer was fairly dry, it took about 2.5 hours before the first sensor at 30 cm responded, followed by the second and third sensors deeper down. Only when the deepest sensor moved was it clear that the water had reached 90 cm and the monitored root zone had received enough water. The lesson: the deeper the sensor and the drier the soil, the longer it takes.
Why that delay is actually useful
Lag time is not a shortcoming of the sensor — it is information. Precisely by watching how long it takes and how deep the water reaches, you get to know your irrigation:
- Does the deepest sensor respond quickly and rise sharply? Then you are pushing water past the root zone: you are irrigating too long or too much per cycle. A waste of water and energy, and leaching of fertiliser.
- Does the deepest sensor barely respond after a normal cycle? Then water stays in the upper layer and you are not reaching the deeper roots. Possibly cycles that are too short.
- Does the middle (control) sensor rise nicely to around field capacity and then fall gradually? That is exactly what you want to see.
What this means for your interpretation
- Never judge an irrigation cycle within the hour. Give the system time. Read the response a few hours after the cycle, and for the field-capacity determination only after 12–24 hours.
- Plan your irrigation before you hit the stress point, not after. Because of the lag time, the water arrives with a delay regardless. If you wait until the sensor touches your refill point and only then irrigate, the tree is already in early stress by the time the water is down below. Account for the delivery time.
- Use the shape of the curve, not just the instantaneous value. A sensor that falls slowly and evenly tells you the tree’s consumption (transpiration, drainage). Sharp peaks and troughs point to heavy, infrequent cycles. Many growers therefore switch from heavy cycles every few days to lighter, more frequent cycles (pulses), which keeps moisture in the root zone more stable.
Step by step: setting up your soil moisture sensor in 7 steps
- Install multiple depths (e.g. 30/60/90 cm) under the drip line, in a representative or deliberately the fastest-drying zone.
- Measure your field capacity per depth: saturate, wait 12–24 h, read off.
- Determine your wilting point from texture/soil analysis or a reliable table value for your soil type.
- Calculate your refill point with MAD ≈ 50% for fruit trees and set those thresholds on your platform — per depth and per plot separately if the soil differs.
- Set your upper limit at field capacity; alarm on prolonged higher values (saturation/oxygen shortage).
- Observe a few irrigation cycles to learn your lag time, and shift your irrigation moment to before the refill point.
- Refine throughout the season. Thresholds are a starting point, not a law. Adjust the allowable depletion according to the phenological phase: critical periods (e.g. cell division/fruit growth) call for a smaller deficit and therefore tighter thresholds.
Buying a soil moisture sensor? What to look for
- Does the device measure %VWC objectively across your soil types? That is the fundamental requirement. Ask for independent validation against the gravimetric or oven method.
- Can you measure per depth? For fruit trees, all but indispensable.
- Can you set the thresholds yourself and differentiate per location/depth? Without that, you cannot apply this approach.
- Does it give the historical curve, not just the instantaneous value? The shape over time is where the insights are.
- How good is the wireless connection through dense foliage? In a mature orchard that is a real point of attention.
Frequently asked questions about soil moisture sensors in the orchard
Which %VWC is ideal for fruit trees?
There is no universal ideal number: it depends on your soil texture. Determine your own target zone between field capacity (measured 12–24 h after saturation) and your refill point (field capacity minus about 50% of the available water). In the worked example above that is 23–32% VWC.
How often should I irrigate with a soil moisture sensor?
Not on a fixed schedule, but when soil moisture approaches your refill point. Because of the lag time, it is best to irrigate just before you hit that point. Lighter, more frequent cycles keep moisture in the root zone more stable than a few heavy cycles.
At what depth do I place the soil moisture sensor?
Measure at several depths, for example 30, 60 and 90 cm, or at roughly one third and two thirds of the effective rooting depth, under the drip line. That way you see the working zone, the control zone and whether water drains below the roots.
Do I have to recalibrate the sensor per soil type?
The sensor no (if it measures %VWC correctly), but your thresholds yes. Field capacity, wilting point and refill point shift with soil texture, so set them per plot and per depth separately.
In closing: from number to decision
A soil moisture sensor is not an automatic irrigation button. It is a measuring instrument that objectively tells you how much water is in the ground. The art — and where the real gains are — is translating that number into the right decision: thresholds that match your soil type and crop phase, sensors at the right depths, and irrigation moments that account for the time water needs to reach the roots. Do that well, and you no longer drift between “giving too little out of fear” and “giving too much just to be safe”, but deliberately steer within the narrow, productive window in which your trees thrive best.
Soil moisture tells you a lot about the ground, but not everything about the tree itself. If you want to know how the tree itself responds to water stress, also read how a dendrometer protects your fruit size in Conference pears. Questions about sensors, thresholds or automatic irrigation? Get in touch with us — PlantData Live takes care of the technology so you can steer on the data.
This guide is intended as a general, educational reference. Specific threshold values, MAD percentages and irrigation decisions remain dependent on your specific plot, variety, rootstock, soil and climate. Validate them in your own orchard.