How do you know if your soil moisture sensor is still measuring correctly?
A sensor that fails, you notice. A sensor that gradually starts to measure wrong, you don't — and yet that is exactly what you base your irrigation decisions on.
There are two broad families of soil moisture sensors. Measuring the volumetric water content is the most common approach: how much water is in the soil. Using matric potential (suction) sensors strictly gives a better indication of what a tree can actually do with the available water. That type expresses how hard a tree has to pull to take up water. Within each of those two units of measurement there are another dozen variations in technology to arrive at a reading.
This article is not about which of those technologies is best. It is about a question that comes before that one: how do you tell from the measurement data itself whether the sensor is still giving a trustworthy value?
A lesson from industry
PlantData.Live was founded by three engineers with years of experience in the monitoring and control of industrial installations. In that world there is a rule of thumb so self-evident that it is rarely spoken aloud: a good system watches itself. The person responsible for the installation should not have to discover that damage has occurred — they should know the moment the system stops measuring reliably.
That philosophy is even built into the wiring. Industrial sensors usually send their signal as a current between 4 and 20 mA. That lower bound of 4 mA is no accident: it exists so that "the measurement is zero" can be told apart from "nothing is coming in anymore". A broken cable gives 0 mA, and that is a value a healthy sensor can never produce. The diagnosis is baked into the design.
In the soil you don't have that luxury. A soil moisture sensor with poor contact gives no error code — it gives a value that is just slightly too dry, every day again, and that value looks perfectly normal. So we have to find the diagnosis somewhere else: in the shape of the time series itself.
How these sensors fail
The failure profiles of the two families are almost mirror images of each other.
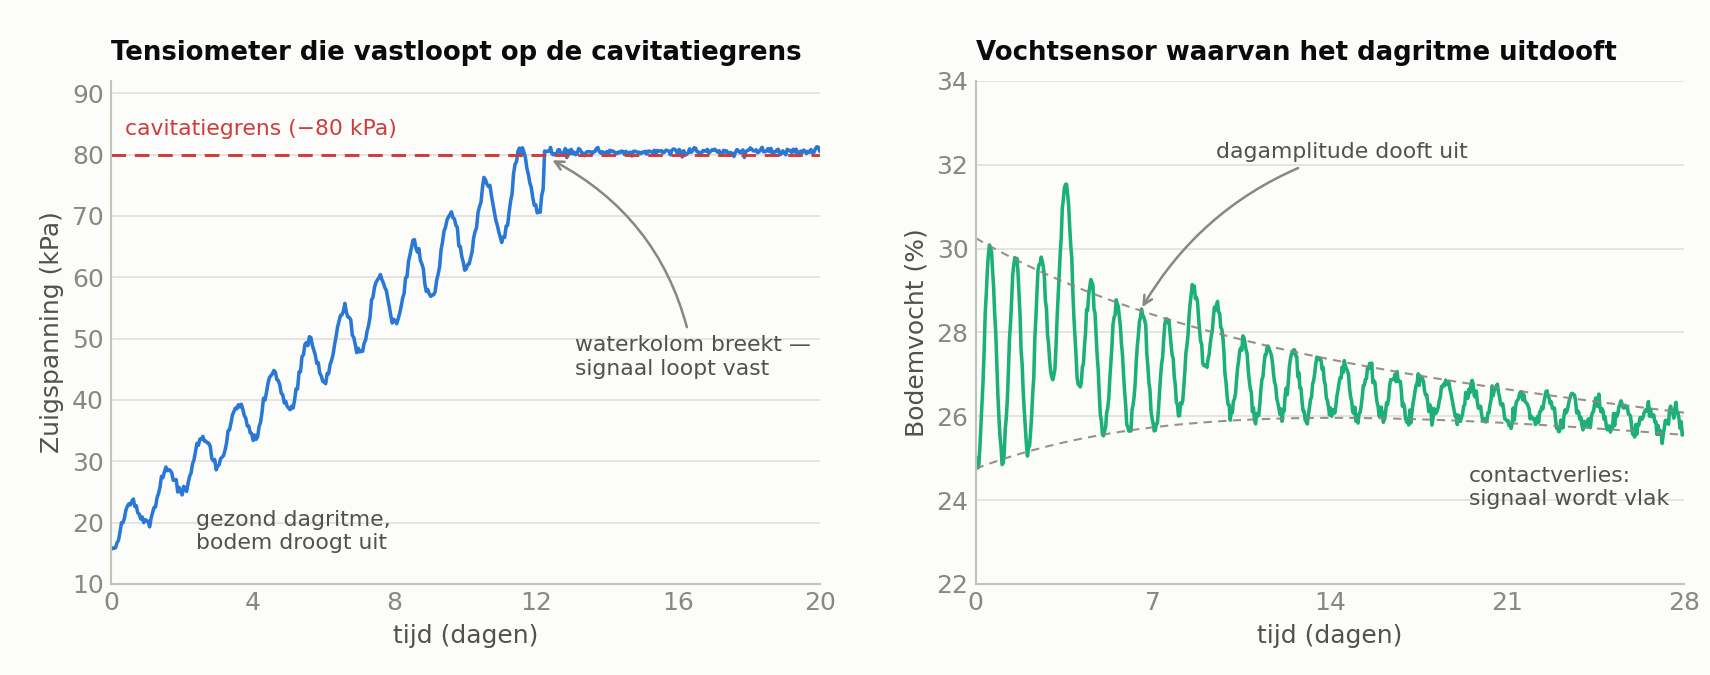
Matric potential sensors typically fail from the inside. In a classic tensiometer the water column breaks around −80 kPa (cavitation), the ceramic cup clogs with biofilm or lime, the reservoir runs dry, or the pressure sensor slowly drifts away. In granular matrix sensors the electrodes corrode and the matrix itself changes over the years.
That translates into a shorter and, above all, less predictable lifespan. For granular matrix sensors the manufacturer counts on five years or more, with the explicit advice to dig them up and check them at that point. A tensiometer can last for years as an instrument, but its useful life is not determined by wear: it is determined by maintenance. Topping up, bleeding after cavitation, keeping the cup clean, and in our climate lifting the frost-sensitive models out of the ground before winter. Skip a season and the sensor still measures — just no longer correctly.
Volumetric water content sensors rarely fail on the inside. Modern versions are fully potted and easily last eight years or more. What goes wrong is on the outside: the contact with the soil. An air gap of a few millimetres, a stone against the measuring face, or shrinkage cracks that in a dry summer pull the soil away from the sensor. Beyond that: cable damage from rodents or machines, water creeping in along a damaged sheath, a sagging supply voltage, and preferential flow where rainwater runs down the installation hole to the sensor instead of through the soil.
The common thread: in one family the sensor breaks, in the other the relationship between the sensor and the soil breaks. You see both back in the data, but you have to look at something different.
What you see in the data
So what gives away that something is going wrong? Rarely a value that looks wrong. Almost always the alarm signal is that the structure disappears from the signal: the series no longer shows the typical behaviour that a healthy sensor in the soil ought to show.
A healthy soil moisture series is not flat. It breathes along with the day, it responds to every shower of rain, it rises in a predictable order between the measuring depths. It is precisely that structure that you monitor.
| What you see | How you detect it | Likely cause |
|---|---|---|
| Flat line, no daily rhythm anymore | rolling standard deviation over 24 h | cable break, cavitation, clogged cup |
| Value sticks to the range limit | threshold on measuring range | cavitation or out of range |
| Exactly identical value, full precision | repeat detection on the unrounded value | the logger returns the last known value |
| Jump without rain or irrigation | step detection, crossed with the weather data | reinstallation, air ingress, loose connector |
| Impossibly fast change | change per hour versus the evaporation ceiling | noise or loss of contact |
| Sharp peak that fully collapses within hours | shape of the response after a shower | water runs down the installation hole |
| Drop to near-dry when soil temperature is below zero | conditional filter on the temperature channel | freezing, not drought |
| Daily amplitude shrinks over weeks | amplitude as its own time series | lime scaling, biofilm or deteriorating contact |
| Missing readings, communication errors | success rate per sensor per day | cable, connector or power — often weeks before real failure |
The two checks that pay off most
Of all the possible checks there are two that in practice carry the most weight.
The response to a shower
This is the sharpest way to tell "the sensor is broken" apart from "the soil is simply dry". After a measured rainfall or irrigation event a healthy sensor in the root zone must move. If the sensor at 30 cm does that and the one at 15 cm does not, then it is the sensor — not the soil.
This check has one condition: you have to know when water fell. Without a rain gauge or an irrigation log per plot, the most powerful check you have simply drops away. That is the single most important reason to include that data stream, even if at first sight it has nothing to do with the tree.
The comparison with the neighbours
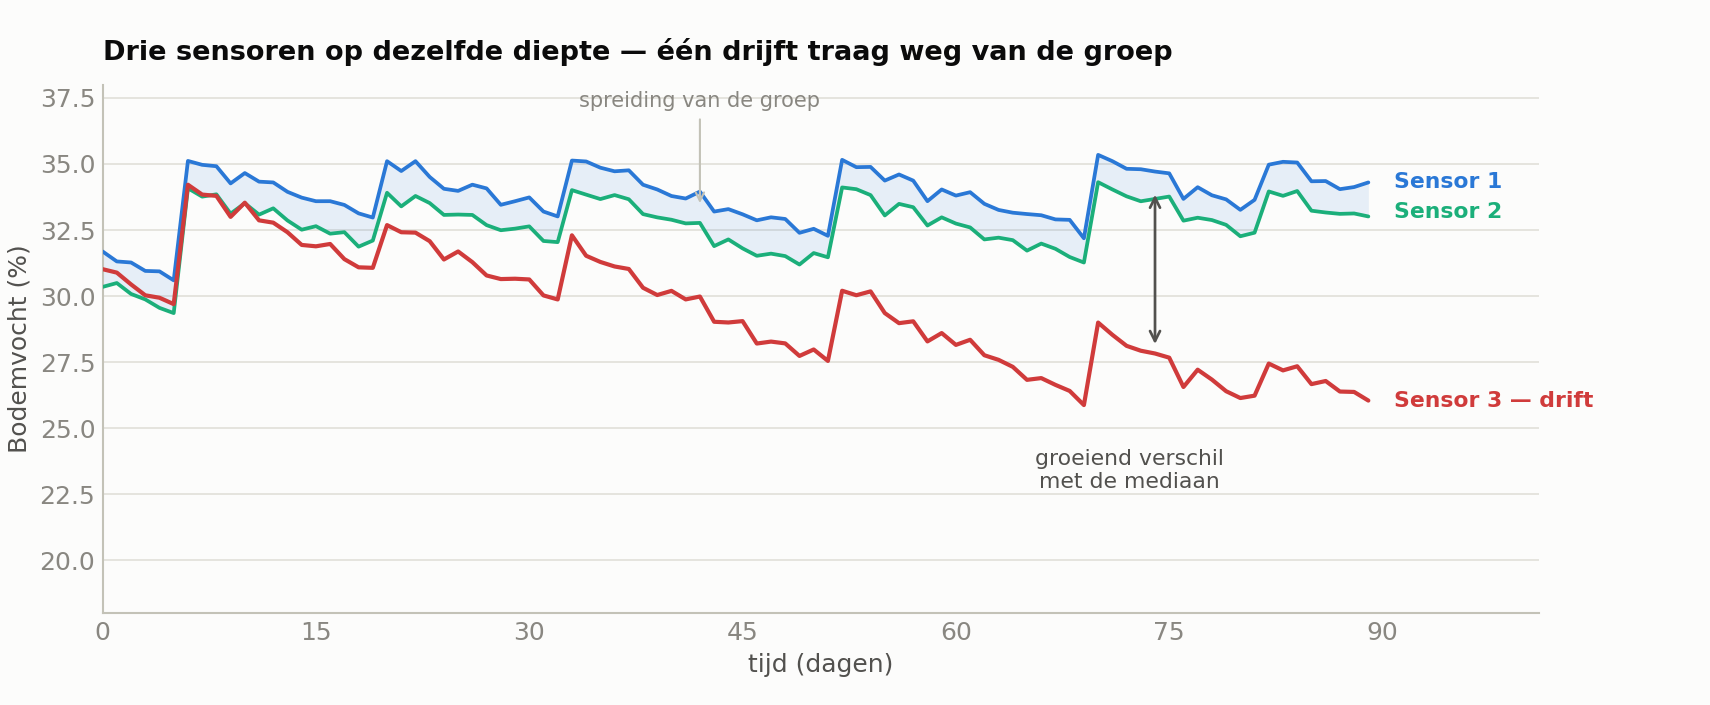
As soon as you have several sensors at the same depth in the same plot, you compute for each sensor the difference from the median of the group. Slow drift shows up there as a slowly growing difference, long before the absolute value looks impossible.
For matric potential sensors this is the only reliable way to catch creeping drift. There is a concrete condition attached to it: you need at least three, in each other's immediate vicinity and at roughly the same depth. With two sensors you can see that they diverge, but not which of the two is right. Only from three onwards is there a middle value to test against, and does the deviating sensor become identifiable. The same depth matters just as much as the proximity, because 15 and 45 cm simply dry out at a very different pace — a difference between those two is normal behaviour, not a fault. For volumetric water content sensors there is a second variant on top of this: the reference plateau. Every saturating shower ought to push the sensor back to roughly the same upper level — the field capacity of that soil. If that plateau sinks season after season, the contact is degrading, even though every individual curve still looks perfect.
What this means for choosing a sensor
Here a principle returns that most spec sheets do not mention. We are a data company. For us the most valuable sensor is one that lasts a long time and — because everything eventually fails — one whose failure modes we can derive from the data as much as possible. Accuracy is not the first criterion here, because an accurate sensor that quietly drifts away is more dangerous than a mediocre sensor that betrays its own derailment.
Three concrete preferences follow from that position.
Raw quantities are worth more than pretty final numbers. A sensor that only reports a moisture percentage hides its failure modes. That same sensor, when it also sends the underlying physical quantity, gives us hard anchor points: that quantity has a known value in air and a known value in water. If the reading is at the air value, the sensor is exposed — that is no longer an interpretation, that is an observation. The final number is identical; the diagnosability is not.
Every extra independent channel is a diagnostic channel. Soil temperature explains frost artefacts. Supply voltage explains drifting analogue readings. Communication statistics warn weeks in advance about a connector drawing water. None of those channels is about soil moisture, and together they determine whether you may trust the soil moisture reading.
Redundancy is cheaper than precision. Two sensors that check each other deliver more usable certainty than one perfectly calibrated sensor that no one can contradict. On top of that, it is the only setup in which drift becomes visible at all.
And from that follows one more consequence for the signal itself: a signal with a lot of structure watches itself. A series with a daily rhythm, a response to rain and a logical order across the depths offers dozens of footholds to check whether everything still adds up. A dull, flat signal offers none. Richness of structure is therefore not an aesthetic property of a graph — it is the raw material of the monitoring. Bringing all sensors together in one central data platform gives unprecedented possibilities to monitor the integrity of every component.
In practice: flag, don't discard
One last principle from the industrial world. Suspect data you do not delete, you flag: good, suspect, or bad. In the graph you show a suspect period in grey, with the reason alongside.
The reason is practical. A gap in a graph raises more questions than a grey zone with an explanation, and the grower or arborist has to be able to judge for themselves how much weight to give that period. Moreover, a flagged measurement stays usable for the later analysis, when it turns out there was nothing wrong at all.
Equally practical is the order in which you build this up. Start with simple, explainable rules — range, flat line, rate of change, response to rain, deviation from the neighbours. Those catch the vast majority of cases, and they have a property no learning model can match: you can explain to the user why there is an alert. "Sensor 3 on plot B has not responded to the irrigation since Tuesday" is a message someone can take into the field with them.
From measurement data to trust
A sensor delivers figures. A monitoring system delivers figures plus a judgement about those figures. That second part is what the PlantData.Live software adds: the measurement data stream in continuously, and at the same time the system watches whether every series still shows the behaviour a healthy sensor ought to show.
That way the most important question stays answered — not only "how much water is in my soil?", but also "can I still believe that number today?"
Frequently asked questions
What is the difference between soil moisture in percent and suction? The moisture percentage says how much water is in the soil. The suction (matric potential) says how hard the tree has to pull to take up that water. The second is closer to what the tree actually experiences, because the same amount of water in sand and in clay demands a very different effort.
How do you tell that a soil moisture sensor is broken? Usually not from the value itself, but from the disappearance of structure: no more daily rhythm, no reaction to rain or irrigation, or a growing deviation relative to neighbouring sensors at the same depth. But you need at least three sensors in comparable conditions to detect a gradually building error, or "drift", quickly.
What is the most dangerous type of sensor fault? Not the failure, but the slow drift. A failed sensor stands out. A sensor that measures a little too dry every day keeps looking credible and steers the irrigation the wrong way for months.
Why is a rain gauge important for monitoring soil moisture sensors? Because the strongest check consists of comparing the sensor response with a known water event. Without knowing when water fell, you cannot tell "the sensor is not responding" apart from "nothing happened".
How many sensors do you need per plot? For the measurement itself one is sometimes enough. For the monitoring you need at least three, close together and at roughly the same depth. With two sensors you notice that something is off, but not which of the two is the culprit; from three onwards there is a middle value to test against.
More from our knowledge base
What is a dendrometer?
How a dendrometer measures growth, daily shrinkage and water deficit — and how you recognise water stress days in advance.
What is vapour pressure deficit (VPD)?
How hard the air pulls water out of the tree — the driver behind water stress.